
APIs
Deep Linking Map Views with HERE Maps API for JavaScript
Alberts Jekabsons — 19 March 2026
8 min read
31 July 2024

A customer recently asked how they could quickly show a CSV (or other tabular format) that has the most basic of spatial reference systems (latitude and longitude values) on a web map application they built with the HERE Maps API for JavaScript. This need was secondary or tertiary to what the apps original purpose was. The HERE Maps API for JavaScript is designed to provide powerful and flexible mapping capabilities. It also works with other JS methods that can do things like fetching and parsing of data. With a basic project and/or boilerplate html file this goal is achievable in a few steps. There are some caveats on fetching, parsing and displaying such data: some datasets may be too big to fetch over the browser without extreme performance issues. This method is best for small datasets and when using other visual data handling methods like clustering.
I recently saw an article about mapping meteorite strikes across the globe in recorded history. The data source was listed as NASA Meteorite Landings. Using a paired down version of that data, this blog post will outline how to easily consume/ingest and display a properly formatted CSV data of points on a map using the HERE Maps API for JavaScript. This can be tweaked for other formats as well. These basic steps will allow us to arrive at a solution:
Setup HERE Maps API for JS: How to set up the HERE Maps API for your project.
Load CSV Data: Loading and parsing a CSV file.
Initialize the Map: Initializing the map on a webpage.
Plot Points on the Map: Adding points to the map and symbolizing them based on the type of data.
First, you need to get an API Key from the HERE platform if you don't have one already. You can signup for free with a couple steps. This basic guide shows you how to generate credentials.
Once you have an API Key, we need a boilerplate HTML file to start that includes the HERE Maps API for JavaScript modules. While I prefer placing scripts in external .js files, this example is going to use a single html file for simplicity. (As a best practice, I would encourage separating HTML & code for ease of reading and maintenance, and also for speed if the app is heavy or processing a lot.) Example HTML:
<!DOCTYPE html><html lang="en"><head> <meta charset="UTF-8"> <meta name="viewport" content="width=device-width, initial-scale=1.0"> <title>HERE Maps API Example</title> <script src="https://js.api.here.com/v3/3.1/mapsjs-core.js"></script> <script src="https://js.api.here.com/v3/3.1/mapsjs-service.js"></script> <script src="https://js.api.here.com/v3/3.1/mapsjs-ui.js"></script> <script src="https://js.api.here.com/v3/3.1/mapsjs-mapevents.js"></script> <link rel="stylesheet" href="https://js.api.here.com/v3/3.1/mapsjs-ui.css"> <style> body, html { margin: 0; padding: 0; height: 100%; } #mapContainer { width: 100%; height: 100vh; } </style></head><body> <div id="mapContainer"></div></body>
This will load all the necessary library components, loading core functionality of the Maps API, our communication with the back-end services provided by HERE REST APIs, and it also creates the basic web map (base map) controls and UI. There also is a script for enabling event handling for the map interactions and a stylesheet for the styles for the UI components.
Since the tabular data I am using is a small extract of the original, I am going to "load" it directly but you can use other methods and libraries, like using JavaScript to read and parse a CSV file (covered below.) We will fetch the CSV data from the same directory as the HTML file using the fetch API, which is built right into modern web browsers:
// Fetch and parse the CSV datafetch('meteorite.csv')    .then(response => response.text())    .then(data => {        console.log('Raw CSV data:', data); // Log CSV data for inspection        const parsedData = parseCSV(data);        console.log('Parsed data:', parsedData); // Log parsed data for inspection        addMeteoriteDataToMap(parsedData);        setMapViewToDataBounds(parsedData);    })    .catch(error => console.error('Error fetching or parsing CSV:', error));
// Function to parse CSV datafunction parseCSV(data) { const rows = data.trim().split('\n').slice(1); // Trim and split rows, then skip header return rows.map(row => { const columns = row.split(','); return { name: columns[0], id: columns[1], year: columns[2], lat: parseFloat(columns[3]), long: parseFloat(columns[4]), mass: parseFloat(columns[5]) }; }).filter(meteorite => { const valid = !isNaN(meteorite.lat) && !isNaN(meteorite.long) && !isNaN(meteorite.mass); if (!valid) console.warn('Skipping invalid meteorite:', meteorite); return valid; });}This will read the fetch response and convert it to text using '.then(response => response.text())'
'.then(data =>{ ... })': executes once the CSV data is available as text:
console.log('Raw CSV data:', data): Logs the raw CSV data for debugging.
const parsedData = parseCSV(data): Parses the CSV data into a more usable format by calling the parseCSV function.
console.log('Parsed data:', parsedData): Logs the parsed data for debugging.
addMeteoriteDataToMap(parsedData): Adds the parsed meteorite data to the map.
setMapViewToDataBounds(parsedData): Adjusts the map view to fit the bounds of the data.'
'.catch(error => console.error('Error fetching or parsing CSV:', error))': Catches and logs any errors that occur during the fetch or parsing process.
The parsing the data function simply processes CSV text by cleaning, transforming, and validating the data into structured objects while discarding any invalid entries.
For an example of reading and parsing with JavaScript, let's assume we have the CSV data available as a JavaScript string (you can modify this to load the CSV from an external file if needed):
// Sample CSV data (you should load this from an external file in a real scenario)const csvData = `name,lat,long,massMeteorite1,34.0522,-118.2437,1000Meteorite2,40.7128,-74.0060,500Meteorite3,51.5074,-0.1278,2000`;// Function to parse CSV datafunction parseCSV(data) { const rows = data.trim().split('\n'); const headers = rows[0].split(','); const result = rows.slice(1).map(row => { const values = row.split(','); return headers.reduce((object, header, index) => { object[header] = values[index]; return object; }, {}); }); return result;}const meteorites = parseCSV(csvData);
Now, let's initialize the HERE map and set the initial view (defined as a lat/long pair and a zoom level). I am using this zoom to show the entire earth since it is a global dataset. The main action here is to add your actual API Key from step 1 and replace the text 'YOUR_API_KEY' with your actual Key:
const platform = new H.service.Platform({ apikey: 'YOUR_API_KEY' // Replace with your HERE Maps API key});const defaultLayers = platform.createDefaultLayers();const map = new H.Map( document.getElementById('mapContainer'), defaultLayers.vector.normal.map, { center: { lat: 0, lng: 0 }, zoom: 1, pixelRatio: window.devicePixelRatio || 1 });const behavior = new H.mapevents.Behavior(new H.mapevents.MapEvents(map));const ui = H.ui.UI.createDefault(map, defaultLayers);
Next, we'll add the meteorite locations as points on the map with circle markers that vary by the "mass" field, which I converted to Kilograms prior. The size of the circle will be based on this "mass" field and the first function adds circles to the map to represent the meteorite data points, and the second function adjusts the map view to ensure all data points are visible.
// Function to add meteorite data to the mapfunction addMeteoriteDataToMap(meteorites) {    console.log('Adding meteorite data to map');    meteorites.forEach(meteorite => {        const { lat, long, mass } = meteorite;        const size = Math.sqrt(mass) * 1200; // Adjust size calculation as needed        console.log(`Adding circle at lat: ${lat}, long: ${long}, size: ${size}`); // Debug information
        if (isNaN(size) || size <= 0) {            console.error(`Invalid size for meteorite: ${meteorite}`);            return; // Skip invalid sizes        }
        const circle = new H.map.Circle(            { lat: lat, lng: long },            size,            {                style: {                    strokeColor: 'rgba(0, 0, 0, 0.6)',                    lineWidth: 1,                    fillColor: 'rgba(255, 0, 0, 0.5)' // Changed color to red for better visibility                }            }        );
        map.addObject(circle);    });}
// Function to set map view to the bounds of the datafunction setMapViewToDataBounds(meteorites) {    if (meteorites.length === 0) return;
    const latitudes = meteorites.map(m => m.lat);    const longitudes = meteorites.map(m => m.long);
    const minLat = Math.min(...latitudes);    const maxLat = Math.max(...latitudes);    const minLong = Math.min(...longitudes);    const maxLong = Math.max(...longitudes);
    // Adjust the minLat to hide the South Pole    const boundingBox = new H.geo.Rect(Math.max(minLat, -60), minLong, maxLat, maxLong);    console.log('Setting map view to bounds:', boundingBox);    map.getViewModel().setLookAtData({        bounds: boundingBox    });
    // Set maximum zoom level to prevent the map from zooming out too far    const maxZoomOut = 2.8; // Adjust this value as needed    map.addEventListener('mapviewchange', () => {        if (map.getZoom() < maxZoomOut) {            map.setZoom(maxZoomOut);        }    });}
Here is the complete code combining all the steps:
<!DOCTYPE html><html lang="en"><head>    <meta charset="UTF-8">    <meta name="viewport" content="width=device-width, initial-scale=1.0">    <title>HERE Maps API Example</title>    <script src="https://js.api.here.com/v3/3.1/mapsjs-core.js"></script>    <script src="https://js.api.here.com/v3/3.1/mapsjs-service.js"></script>    <script src="https://js.api.here.com/v3/3.1/mapsjs-ui.js"></script>    <script src="https://js.api.here.com/v3/3.1/mapsjs-mapevents.js"></script>    <link rel="stylesheet" href="https://js.api.here.com/v3/3.1/mapsjs-ui.css">    <style>        body, html { margin: 0; padding: 0; height: 100%; }        #mapContainer { width: 100%; height: 100vh; }    </style></head><body>    <div id="mapContainer"></div>    <script>        // Initialize the platform object        var platform = new H.service.Platform({            apikey: 'YOUR_API_KEY' // Replace with your API key        });
        // Obtain the default map types from the platform object        var defaultLayers = platform.createDefaultLayers();
        // Instantiate (and display) a map object        var map = new H.Map(            document.getElementById('mapContainer'),            defaultLayers.vector.normal.map,            {                center: {lat: 0, lng: 0},                zoom: 1,                pixelRatio: window.devicePixelRatio || 1            }        );
        // Enable the map event system        var mapEvents = new H.mapevents.MapEvents(map);
        // Instantiate the default behavior, providing the mapEvents object        var behavior = new H.mapevents.Behavior(mapEvents);
        // Create the default UI components        var ui = H.ui.UI.createDefault(map, defaultLayers);
        // Fetch and parse the CSV data        fetch('meteorite.csv')            .then(response => response.text())            .then(data => {                console.log('Raw CSV data:', data); // Log CSV data for inspection                const parsedData = parseCSV(data);                console.log('Parsed data:', parsedData); // Log parsed data for inspection                addMeteoriteDataToMap(parsedData);                setMapViewToDataBounds(parsedData);            })            .catch(error => console.error('Error fetching or parsing CSV:', error));
        // Function to parse CSV data        function parseCSV(data) {            const rows = data.trim().split('\n').slice(1); // Trim and split rows, then skip header            return rows.map(row => {                const columns = row.split(',');                return {                    name: columns[0],                    id: columns[1],                    year: columns[2],                    lat: parseFloat(columns[3]),                    long: parseFloat(columns[4]),                    mass: parseFloat(columns[5])                };            }).filter(meteorite => {                const valid = !isNaN(meteorite.lat) && !isNaN(meteorite.long) && !isNaN(meteorite.mass);                if (!valid) console.warn('Skipping invalid meteorite:', meteorite);                return valid;            });        }
        // Function to add meteorite data to the map        function addMeteoriteDataToMap(meteorites) {            console.log('Adding meteorite data to map');            meteorites.forEach(meteorite => {                const { lat, long, mass } = meteorite;                const size = Math.sqrt(mass) * 1200; // Adjust size calculation as needed                console.log(`Adding circle at lat: ${lat}, long: ${long}, size: ${size}`); // Debug information
                if (isNaN(size) || size <= 0) {                    console.error(`Invalid size for meteorite: ${meteorite}`);                    return; // Skip invalid sizes                }
                const circle = new H.map.Circle(                    { lat: lat, lng: long },                    size,                    {                        style: {                            strokeColor: 'rgba(0, 0, 0, 0.6)',                            lineWidth: 1,                            fillColor: 'rgba(255, 0, 0, 0.5)' // Changed color to red for better visibility                        }                    }                );
                map.addObject(circle);            });        }
        // Function to set map view to the bounds of the data        function setMapViewToDataBounds(meteorites) {            if (meteorites.length === 0) return;
            const latitudes = meteorites.map(m => m.lat);            const longitudes = meteorites.map(m => m.long);
            const minLat = Math.min(...latitudes);            const maxLat = Math.max(...latitudes);            const minLong = Math.min(...longitudes);            const maxLong = Math.max(...longitudes);
            // Adjust the minLat to hide the South Pole            const boundingBox = new H.geo.Rect(Math.max(minLat, -60), minLong, maxLat, maxLong);            console.log('Setting map view to bounds:', boundingBox);            map.getViewModel().setLookAtData({                bounds: boundingBox            });
            // Set maximum zoom level to prevent the map from zooming out too far            const maxZoomOut = 2.8; // Adjust this value as needed            map.addEventListener('mapviewchange', () => {                if (map.getZoom() < maxZoomOut) {                    map.setZoom(maxZoomOut);                }            });        }    </script></body></html>
Try to run the above code in your local or dev environment to see the results:
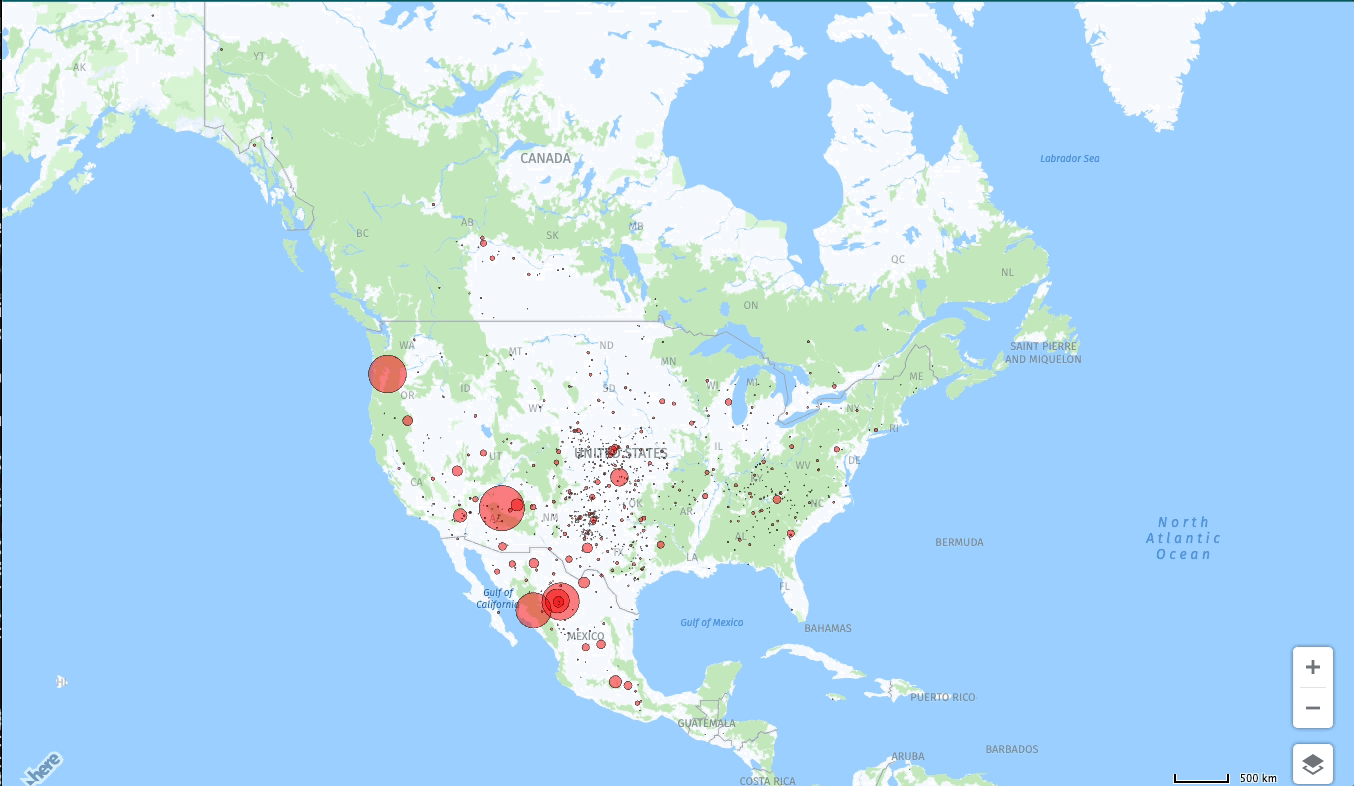
This is just the starting point. Customize further as needed by adding interactivity to the markers, display information on click or hover or try graduated symbology or clustering the data. Be sure to browse the Maps API for JavaScript examples for other ideas.
This blog post covered visualizing geographic data from a CSV file on a map using the flexible HERE Maps API for JavaScript and a browser-ready JS interface, like the Fetch API, that allows you to interact with HTTP requests. By following these steps, you can easily plot points from tabular data and customize drawing the symbols. Add elements like graduated colors or sizes based on specific attributes from your CSV files containing lat/long or tweak for other tabular formats. Feel free to adjust the code to better suit your needs!
Reach out to us on our slack workspace heredev if you have any questions! Happy coding!

Aaron Falk
Principal Developer Evangelist
Share article
Why sign up:
Latest offers and discounts
Tailored content delivered weekly
Exclusive events
One click to unsubscribe

