Visualize vast data
Businesses today are coping with large amounts of data and looking for ways to transform it into action.
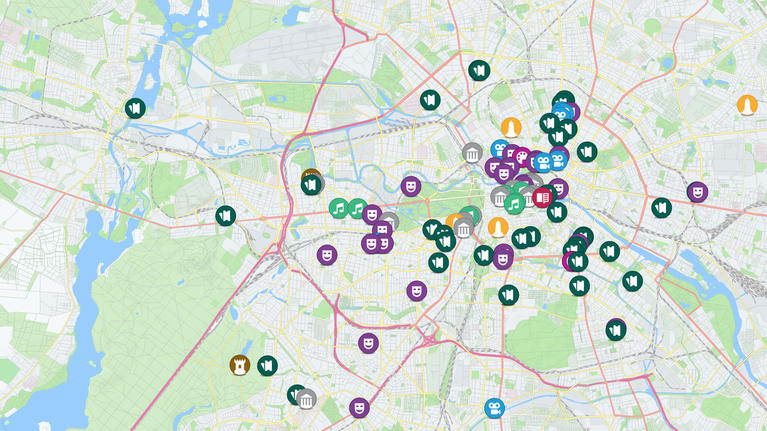
Geographic visualizations are becoming essential when it comes to exploring these data sets, facilitating learning and developing solutions to complex problems.
Geovisualization allows businesses to visualize analytics and display them directly on HERE maps, helping to simplify concepts and identify new patterns in geographic areas. Business can unearth value through charts and graphs, while interactively changing what data is displayed and how it’s processed.
Reliable data, insightful visualizations

Accurate and fresh location services
Obtain fresh, precise location information so you can make more informed decisions. HERE captures location data via an industrial process that assures map accuracy down to centimeters. This is essential when business data needs to be visualized on the map through an accurate geocoder and reverse geocoder service.

Out-of-the-box visualization styles
Get immediate insights into business data and eliminate the need for heavy coding. Geovisualization comes with professionally designed out-of-the-box visualization libraries that reveal relationships between datasets and provide insights that get reflected in the bottom line.
A robust toolbox
Organize with ease and reach new levels of efficiency. Web-based developer tools allow you to upload and organize datasets in the HERE could, remove redundant data and combine date. You can also share datasets with other internal users or publicly, enabling effective collaboration.
Product applications

Under the hood
The keys to any successful geographical visualization are data, location and map visualization.
Geovisualization supports the upload, storage, querying, geo-enrichment and display of customer data right onto HERE maps.
Our vast library of visualization styles comprises of choropleth, raster maps or grid maps, density or heat maps, and market maps, as well as visualization methods such as charts and graphs.
How Geovisualization works
Secure data hosting
Data is uploaded fast through a data manager interface or directly through the API. A sophisticated authentication mechanic protects the data from being accessed by anyone else.
Location enrichment
Once uploaded, data is processed and prepared in the HERE cloud. Latitude and longitude are derived from an address, and geo-enrichment and other attributes are added for more detail. Data can be queried and delivered for geographical visualizations.
Geovisualizing data
Data can be displayed through a variety of visualization techniques and mapping styles, all available through a set of client-side libraries. These come with powerful built-in features and can be deeply customized for tailor-made functionality.
Resources
Tech Documentation
Geovisualization is a toolkit for developing sophisticated visualizations of large sets of geographically-related data.
Ovum Location Platform Index 2019
The relative strengths and weaknesses of each vendor, including data, enablers and features, and why HERE cements its position as the location industry leader.
